Loss of delta hedging
Delta hedging at rapid changes in stock prices
Sept 15th, 2011, USD2.3bn loss in the non-approved deal was revealed by a trader in a European financial institution. The trader’s delta relation deal made big losses to exceed permissible risk because stock market tumbled in Aug 2011.
This sudden fall in stock market effects directly to asset price changes of ETF linked with stock indices that are faced with the trouble in non-approved deal in the European financial institution. The indices are DAX in Germany, S&P in the USA, and EuroStoxx. These ETFs linked with stock indices are traded for the purpose of risk averse. It combines ETFs and options of its stock indices in order that the sum of asset prices becomes neutral. This is a method to generate a portfolio composed of underlying asset and derivatives which were known as ”Delta-neutral strategy”.
Such a methodology or risk measurement method is based on the assumption that the distribution of changes of asset price approximates the normal distribution. According to a mathematical model, it happens frequently in spite of on the edge of the price distribution curve which relies on the normal distribution. The outline of stochastic distribution is “fat tail”. The risk management indices based on the normal distribution, such a mathematical model does not adapt exceptional events in the area.
Risk management based on financial technology as a risk measurement method assumes that the distribution of expected return relies on the normal distribution. It measures the price fluctuation risk of holding assets and client assets in a mathematical model which depends on the normal distribution.

But real world economic environment, a low probability event that applied for the normal distribution happens frequently such as a sudden fall in stock price in the world market in Aug 2011.
The risk evaluation is restricted within the range of knowledge and experience held by personal, crowd or organization. Even if it assumes a low provability event, the assumption is only in a range of shared knowledge of the crowd.
VaR(Value at Risk)1type model, risk measurement standard is restricted in the range of shared knowledge of the crowd. The distribution of real world expected return of investment does not correspond to the normal distribution.
VaR and similar Risk management method of VaR, VaR and potential loss depends on the price change distribution. Uncertainty shows percent according to VaR, it leads to exclude the complexity by ignoring the uncertainty, decision-making focus on the most probable event. It assumes the most probable event as a risk which depends on the normal distribution, and decide the best choice on the assumption. The price change distribution approximated the normal distribution is a mere model.
Delta neutral
Delta of the option is the sensitivity of price changes about the underlying asset price S.:
Δ(S,δ) = ∂f(S,δ)/∂S. Option price f=f(S,δ)
Normal delta hedge strategy adapts units of option to Δ unit of underlying asset. where As a result of sell x units option, and buy Δ x units of underlying asset, the value of this hedge portfolio
V=Δx S - x f(S,δ)
∂V/∂S=0
In the case of this deal, purchasing ETF of the stock indices DAX, S&P, and EuroStoxx, that “delta neutral” portfolio is composed of ETFs and options.
Delta approximation in response to portfolio value changes is a linear function in response to the underlying asset.
Generating delta hedging, in theory, replaces a composition ratio of the portfolio because of delta changes in response to underlying asset price changes. In reality, replaces a composition ratio when delta changes to some extent.
The model of the process of rapid change in stock price
Where it investigates option pricing and hedging of the model which contained an underlying asset price jump. It is impossible to hedge option incomplete in this case.
In case an investor generates delta-hedging (Black-Shoals type hedge), purchasing stock and selling option(CALL option) that can describe as equation(1). This can gain the profit more than expected return kp*>0 by hedge position kp*<0 in the passage of time. But in a rare case of rapid changes in stock price, in comparison, large loss will be generated.
(Expected return of a Black-Shoals type hedge portfolio)
dP/P = (αp* - λkp*)dt + dqp* -----------------(1)
This equation(1) can describe as following.
dP/P = (αp* - λkp*)dt ---------- (2) in case a poisson event dos not happen
= (αp* - λkp*)dt + (Yp* -1) ------(3) in case a poisson event happens
This large loss happens frequently, an investor generates an against side Black-Shoals type hedge position, selling stock and purchasing option. In this case of the passage of time, in most cases, the profit(or loss) is less than expected return. But in case rapid changes in stock price, it generates a large profit.
【An asset model contained jump process】
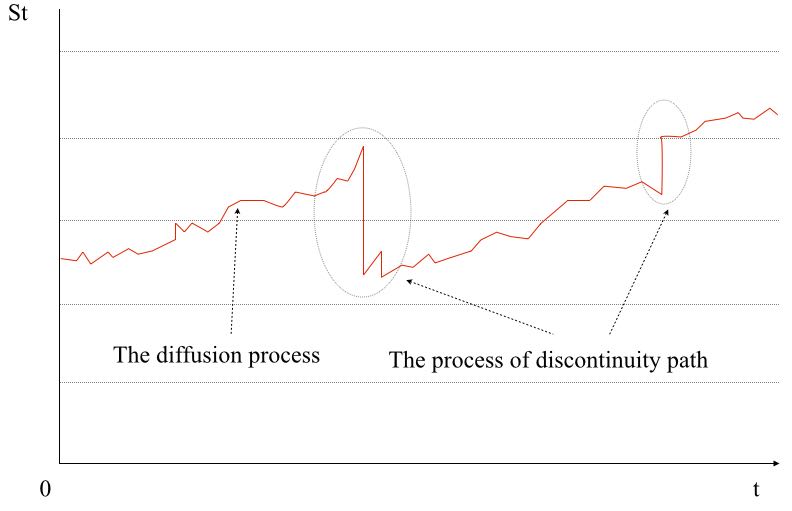
The stock price of Black-Shoals pricing model is a time continuous function. But a random event(news of economic indices, political event, natural disaster, changes of international relations) happens a rapid change of the price. Modeling this process introduces the stochastic process of discontinuity path.
Under the Efficient market hypothesis, the stock price changes describe as a winner process that is similar to the behavior of Brownian motion. The stock price changes describe as a Poisson process here.
A Poisson process
1(x>0) λ e - λx dx
A row of stochastic variables relies on common distribution.
where put γn = Σi=1 Ti
Ni = Σ 1(γn ≦ t) = Σ n1 (γn ≦ t ≦γn+1)
n≧1 n≧1
defined as stochastic variable Ni is called Poisson process in density λ
Parameter λ of above Poisson process determines a frequency of jump.
As an event of Poisson distribution corresponds to a case of notice the important information of the stock.(bad news, good news)

λ shows an average of events happens(frequency), stock prices at time t as St, random variable Y, and ignore the continuity part of the diffusion process in the figure. The stock price after the passage of time t+h describes as St+h = St Y (Y is stochastic variable)
A simple path of the stochastic process described in the theory of stochastic differential equation(mathematical model shown as the Ito-type stochastic differential equation) of the diffusion process(Winner process) which shows the equation of motion of the Brownian motion. On the other hand, the stochastic differential equation of Poisson process has a similar theory. The return of the stock shown as a figure composed of the theories of the Poison process and the dissuasion process. A stochastic variable Uj defined as which relies on the Poisson process, the stochastic process Xt is
dXt = Xt( μ dt + σ dZ) --------------(4)
Stock price behavior St is the stochastic process Xt, The return of the stock (on the condition St=S) describes as a following stochastic differential equation.
dS/S = (α - λk) dt + σ dZ + dq ------------------ (5)
where α is an expected return of a stock, σ2 is a variance of return on the condition there is no new information(no Poisson event), dZ shows the standard Gauss-Winner process, q(t)is independent Poisson process of (4). dq and dZ are independent, λ is the frequency of event happens in a term.
put k as k =ε{Y-1}
(Y-1 is random variable which shows the ratio of stock price changes in case of Poisson event happens, ε is expected operator of Y)
This equation (5) can describe as following.
dS/S = (α - λ k) dt + σ dZ -------(6) in case a Poisson event does not happen
dS/S = (α - λ k) dt + σ dZ + (Y-1) --(7) in case a Poisson event happens
where Poisson event does not occur more than 1, (Y-1) is impulse function arise finite jump from stock proce S to Sy . As a result of this, sample path of S(t) contains continuity part and points of finite a difference code and width jump(figure). If α, λ, k, σ are constant, the ratio of the random stock price at time t describes following equation. when S(0) is S,
S(t) /S = exp[ (α - σ 2 /2 - λ k ) t + σ Z(t) ] Y(n) --------(8)
The return of stock price shows above equation. Focusing on option prices. It assumes option price W is the function of stock price and time.
W(t) = F(S,t)
If the stock price can describe as equation(5), the return of option describes as same form.
dW/W = (αw - λkw) dt + σw dZ + dqw -----------(9)
where αw is expected return of option, σw 2 is variance of return on the condition that poisson event does not happen, qw(t) is independent of poisson process λ.
put kw as kw =ε{Yw-1}.
(Yw-1) is random variable that shows the ratio of a stock price changes when a poisson event happens. ε is expected operator of random variable Y.)
To apply the Ito’s formula of stochastic differential equation, lead a following solution.
αw = [1/2 σ 2 S 2 Fs(S,t) + (α - λk) S Fs(S,t) + Ft + λε{F(SY,t) - F(S,t)} ] / F(S,t)
σw = Fs(S,t) σ S/ F(S,t) ---------------(11)
A portfolio composed of stock and option shows same form. When P is a portfolio value, the return of the portfolio defined as follow.
dP/P = (αp* - λkp*)dt + σp dZ + dqp* -------------------(12)
If underlying asset prices is rapid change, it is impossible to hedge an option incomplete.
It is also impossible stable funds management in case of generating the funds that composed of only option and futures.
In Aug 2011, sudden fall in world stock market
The currency intervention was the trigger for sudden fall in stock prices in USA and Eurozone in Aug 2011. The Bank of Japan intervened into FX(foreign exchange) market to operate sell JPY buy USD.
The strong yen updated the highest value in the past which nominal rate was historical high level due to the strong yen demand. USD/JPY market is an object for the purpose of some deal using an intervention opportunity which is no relation to real demand. The leveraged deal continued to make the strong yen. The government determination to intervene into FX market expected to shift FX rate to the weak yen, it reflected sunk cost.
On Aug 4th, 2011, the finance ministry in Japan intervened into the FX market to operate USD/JPY FX rate against G.20 accord in Nov 2010. The same day in London market, SNB(Swiss National Bank) also intervened into FX market to try to correct the FX rate to the weak Swiss Franc against dollar and euro. Focusing on USD/JPY FX rate, the rate changed JPY 1 temporally, it returned to the beginning level on next day.
The Japanese currency intervention did not affect FX rate at all -in this time.1
As a result of the currency intervention into USD/JPY FX market, the finance ministry gave the large amount of money into the private FX trading account.2 Then large-scale deal in FX trading operated FX rate in London and NewYork market. Sold off the main currencies, then AUD/USD, GBP/USD, EUR/USD main 3 currencies against Dollar rate were rapid change.
The currency interventions in JPY, Swiss Franc and the deal of main 3 currencies against dollar by FX trading, the prices of main 5 currencies against dollar fall down sharply(it happened the strong dollar demand against all currencies). This event generated extreme fluctuation of asset prices in domestic currency so that institutional investors corrected the holding assets. Investors sold off the holding stocks across the counties in response to rapid change in FX rates. Then stock indices sudden fall extremely in both USA and Eurozone.
The following table shows the fluctuation of currency pairs operated FX rate by FX trading on Aug 4th.
| FX | 8/4 TKY | 8/4 NY | Range | Percent changes |
|---|---|---|---|---|
| EUR/USD | 1.4370 | 1.4059 | -0.0311 | -2.21% |
| GBP/USD | 1.6438 | 1.6232 | -0.0206 | -1.23% |
| AUD/USD | 1.0778 | 1.0428 | -0.0350 | -3.36% |
Aussie $1.1005 on Aug 2nd, sudden fall USD-0.600 in 2 trading days. Consequently correcting holding position of assets across the countries in a risk averse, stock indices in the world stock markets fell sharply.
| Indices | 8/3 | 8/4NY | Percent changes |
|---|---|---|---|
| FTSE | 5584 | 5393 | -3.5% |
| DAX | 6714 | 6414 | -4.7% |
| CAC | 3515 | 3320 | -5.8% |
| NIKKEI | 9659 | 9299 | -3.8% |
| DOW | 11896.44 | 11383.68 | -4.31% |
| S&P | 1260.34 | 1200.07 | -4.78% |
| NASDAQ | 2693.07 | 2556.39 | -5.08% |
Similar FX trading operated FX rate on Aug 8th next week, as a result of this, Aussie fell more than 10% in 4 trading days.
| FX | 8/8 TKY | 8/8 NY | Range | Percent changes |
|---|---|---|---|---|
| EUR/USD | 1.4399 | 1.4155 | -0.0244 | -1.72% |
| GBP/USD | 1.6470 | 1.6271 | -0.0199 | -1.22% |
| AUD/USD | 1.0444 | 0.99310 | -0.0513 | -5.17% |
Consequently, stock market fell sharply on record since Lehman shock, sold off to correct holding assets in response to rapid change in FX rates, the stock indices in the world stock market tumbled as following.
| Indices | 8/5 | 8/8NY | Percentage |
|---|---|---|---|
| FTSE | 5247 | 5068 | -3.5% |
| DAX | 6236 | 5923 | -5.0% |
| CAC | 3279 | 3125 | -4.7% |
| NIKKEI | 9097 | 8944 | -2.5% |
| DOW | 11444.61 | 10809.85 | -5.6% |
| S&P | 1199.38 | 1119.46 | -6.7% |
| NASDAQ | 2532.41 | 2357.69 | -6.9% |
| Indices | 7/1 | 9/9 | Percentage |
|---|---|---|---|
| DJI | 12582.77 | 10992.13 | -14.5% |
| NASDAQ | 2816.03 | 2467.99 | -14.1% |
| S&P | 1339.67 | 1154.23 | -16.1% |
| FTSE | 5989.76 | 5214.65 | -14.9% |
| DAX | 7419.44 | 5189.93 | -43% |
| CAC | 4007.35 | 2974.59 | -34.7% |
| EuroStoxx | 2875.67 | 2073.67 | -38.7% |
| Nikkei | 9867.07 | 8737.66 | -12.9% |
| HangSeng | 22398.10 | 19866.63 | -12.74% |
| Shanghai | 2759.36 | 2497.75 | -10.5% |
The world stock market in whole Aug fall 10%~30% in Eurozone and the USA, more than 10% in Asia. Index futures that the financial institution in the Eurozone faced the problem, a period of settlement July to September, the following table shows fluctuation range of the world main stock indices on the assumption of a basis of the term defined as Jul 1st to Sept 9th. German DAX main economic country in the Eurozone fell 43%, France CAC fell 34.7% in this term. Asset prices falling affects damaged the balance sheets worse in private sector.
Decrease in total market price of the world stock market in the quarter from July to Sept, in comparison of DowJones(-1500) which corresponds to as much as the 3/4 amount of loss in financial crisis after the Lehman shock3(Dow:-2074) that reconstructed the financial sector to inject capital on 4th quoter 2008. Eurozone suffered more heavy loss.
The sudden fall in stock market in the USA and the Eurozone, stock indices DAX, EuroStoxx and S&P that the financial institution faced the problem, shows extreme price fluctuation more than expected range. All institutional investors held similar hedge position accept a loss by the event in August. The event in stock market shrank credit in private sector that affected the government's debt in the Eurozone.

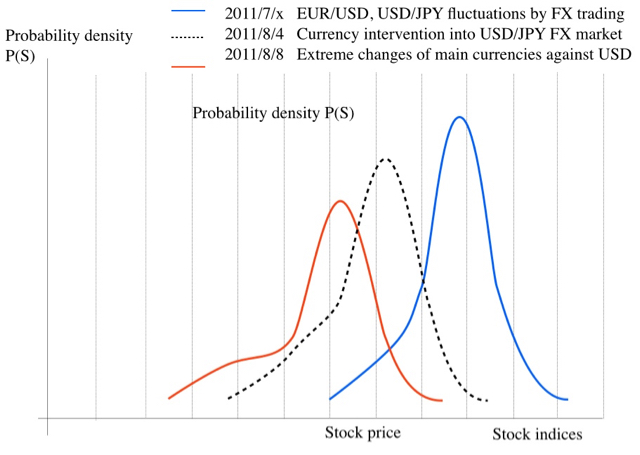
Figure. Probability density function(Price change distribution)
Even if the event sudden fall in stock price is a rare case on the price change distribution based on financial technology, the probability of the downside risk on bell-curve is restricted in the range of their knowledge as a model.
Specific someone has continued to operate a rapid change in EUR/USD FX rate more than 5% frequently since Nov 2010. The market behavior does not reflect both economic fundamentals and financial policies, and an extreme behavior of asset market reflects the changes in EUR/USD FX rate.
The common feature of the financial crisis is that asset prices fall down in the correcting process it after boom end. A different point in the Eurozone crisis, a result of that it devalues the currency which seems normal healthy economy (and as a result of increasing volatility in FX rate frequently in long-term continuously) generates the same situation of bubble collapsed. The result of asset price down, the damaged balance sheet makes additional debts, that leads to shrinking economic activities in nationwide scale.
It shows the rate of stock price falls down at Lehman shock as a comparison, FTSE100 in London -31.3%, Frankfurt DAX -40.4%, Paris CAC -42.7%.