Alternatives


C(St,t) = St N(ht) - K e -r(T-t) N(ht - σ√(T-t))
ht = 1/(σ√(T-t))log(St/K e -r(T-t))+ (1/2)σ√(T-t)
Derivatives
C(St,t) = St N(ht) - K e -r(T-t) N(ht - σ√(T-t))
AIS Alternative Investment Strategy
Currencies and Foreign Exchange Market
Foreign exchange market traded in 24 hours opening from Sydney then Tokyo, London, to closing at NewYork. FX market is most thick liquidity in global market.

It is 40 years since floating foreign exchange market has started and Bretton Woods system end in 1971. Japanese yen rate sometime revalued from 360yen/1$. Although the Department of Treasury intervened the market as exceptional cases, International Monetary System is under control by the float system.
USA, Japan and West-Germany intervened the market for revaluation the yen rate after the Plaza accord in 1983. Then the long-term recession had started after the boom and the bust of asset bubble happened in Japan. The debt translated from private sector to public sector dealing with the bad-loans and the Government spend money for depression economy. Approved the law of foreign exchange management amendment in 1997, Fx market was proceeding to an another stage in Japan.
The market has more thick liquidity after the financial deregulation, everyone can trade many currency pairs in domestic country.
Currency pairs traded in FX market.
Currencies traded in the market are listed below.
| currency | JPY | USD | GBP | EURO |
|---|---|---|---|---|
| USD | USD/JPY | GBP | GBP/JPY | GBP/USD | GBP/EUR | EURO | EUR/JPY | EUR/USD | JPY | AUD | AUD/JPY | AUD/USD | AUD/GBP | AUD/EUR | NZD | NZD/JPY | NZD/USD | NZD/GBP | NZD/EUR | CHF | CHF/JPY | CHF/USD | CHF/GBP | CHF/EUR | ZAR | ZAR/JPY | ZAR/USD | ZAR/GBP | ZAR/EUR | CNY | CNY/JPY | CNY/USD | CNY/GBP | CNY/EUR | HKD | HKD/JPY | HKD/USD | HKD/GBP | HKD/EUR | MXN | MXN/JPY | MXN/USD | MXN/GBP | MXN/EUR | BRL | BRL/JPY | BRL/USD | BRL/GBP | BRL/EUR | TRY | TRY/JPY | TRY/USD | TRY/GBP | TRY/EUR | INR | INR/JPY | INR/USD | INR/GBP | INR/EUR |
Derivatives
Futures, Options
Osaka stock exchange started to trade derivatives, Futures and Options in 1989. Option trading come to existance on CME in 1973. Option, Swap, Warrant and other derivatives traded in the market.
Extended option market, futures and options of world stock indices contained Nikkei225 in Japan are traded in the market.
Futures buy/sell prices of an underlying asset at a certain period of time. There is no asset as a security so that the numerical value such as indices or prices are traded.Option trading sell or buy the right of “sell” or “buy” an underlying asset or indice at a certain period of time. This is also trade the rights which does not trade a security of underlying asset.
Usually it trades for risk hedging, and holds to exclude future expected loss.
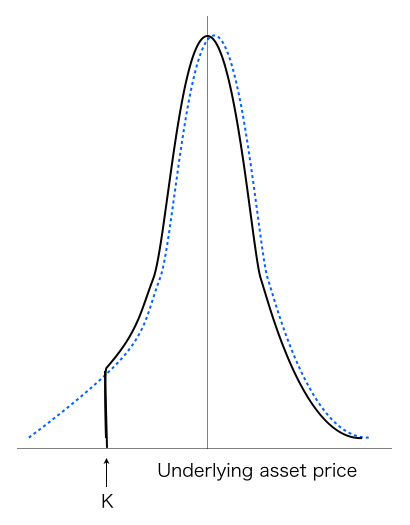
Figure1 Price change stochastic distribution

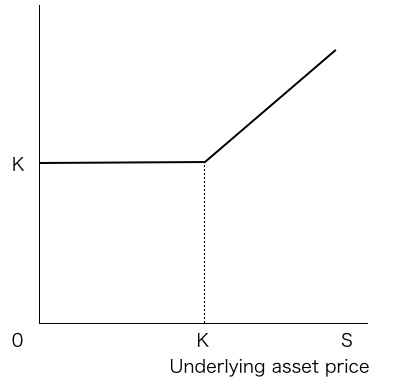
Figure1 is an example of excluding downside risk to combine an option to an underlying asset.The figure of bell-curve shows stochastic distribution of price changes.Combining put option cuts a part of large price down side that the left side of stochastic distribution curve. The price of portfolio combined underlying asset with an option is not down at the cut off point K(Figure.2). Focus on option trading, the price is a point of ATM(at the money) that is the effective point to exercise option’s right.
Figure2

Although the portfolio of the figure can exclude the down side risk by hedge position, it costs risk hedge. This expense of risk hedging is a price of buying options.
The expected return of the portfolio is lower due to the cost of option prices for risk hedging.
In case of trading only options, once underlying asset price changes large scale, the option price is several times as many changes as underlying asset price. Stochastic distribution curve of the underlying asset price shows very thin tail.